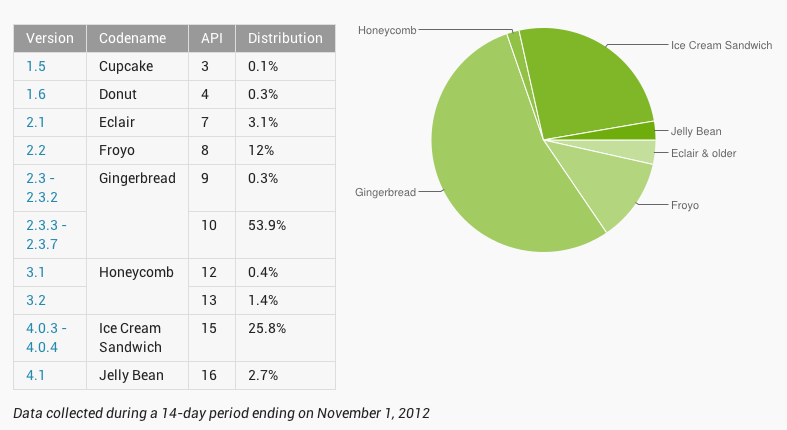
That time has rolled around again: A new month and a new chart released by Google depicting which Android OS versions are powering the Android ecosystem.
Worth mentioning first is the fact that Android 4.0 Ice Cream Sandwich now sits at 25.8 percent of all Android devices. Ice Cream Sandwich is up 2.1 percent since October likely due to a number of software updates rolling out combined with a bevy of new releases worldwide.
Android 4.1 Jelly Bean saw an increase from 1.8 percent to 2.7 percent with plenty of expectation for that to grow as Samsung starts to trickle out Jelly Bean for the Galaxy S III along with Galaxy Note II sales starting in the US.
The release of Android’s version breakdown comes on the heels of a new report from the International Data Corporation (IDC) that says 75% of all smartphones shipped in the third quarter of this year ran Android, a total of 136 million devices within those 3 months.
In comparison, Apple shipped 14.9% of the smartphone market, or 26 million devices. RIM shipped only 4% of all devices. Windows Phone shipped 3.6 million units worldwide, though Microsoft’s OS’s recent iteration has not yet hit the market in full swing, so this number is expected to heavily increase by the time the holidays hit.


